

![]()
Chart Interpretation and
Technical Analysis BasicsCharts
have been used for many years to track the price movement of a commodity. By using a chart we can get a clear picture of where prices have been. The objective of this report is to help you understand the basics of a bar chart and then we will go a step further to teach you how to identify classic chart top and bottom formations. A true chartist and technician believes the market discounts everything all the time, since there is no such thing as insider information in commodities then it could be said that the market price is reflecting all the fundamentals all the time. A chart reflects the market participants reactions to price movement. Let me clarify myself, If the price of Corn goes down to $2.10 / bushel three times within a 3 month period and bounces off this level; this is reflective of the opinion that a majority of market participants are buying and a minority are selling. We will start w/the basic structure of a bar chart.
A chart may be created or formed using any time frame from a monthly time frame all the way down to a 1 minute time frame, however, most traders use a daily bar chart to identify the formations described in this report.
We must first identify a trend before we can indentify a top or bottom The definition of an uptrend is a series of higher highs and higher lows preferably with the 2nd low above the 1st high. The following line graph will help explain.
Conversly, a definition of a down trend is a series of lower lows and lower highs preferably with the 2nd high lower than the 1st high.
A consolidation can be classified as sideways movement in price

During this consolidation phase we will stay alert for this either a continuation of the previous trend or a reversal (top or bottom) of the previous trend; by looking for a rise above the high within this consolidation or a break beneath the consolidation lows.
Generally a change in trend will occur gradually. The following example will help clarify:
Take note that peak 7 did not exceed peak 6, this is our 1st warining of a trend change. This leads us to the 1st basic top formation, the head and shoulders. This failure to make new highs stands to reason that there are not enough buyers to make new highs.
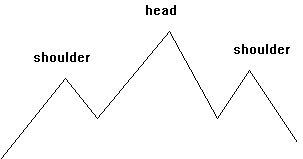
When the right peak fails to exceed the "head" this is our first warning sign that we may be entering into a consolidation phase or a trend change. Our confirmation of a trend change occurs when prices break whats called the neckline.
The neckline can be drawn by connecting the two lows at points 2 and 4. The following graph will explain.
At point 6 the failure to hold above the neckline is our clue that we have changed directions in the trend. I recommend that you practice drawing a head and shoulders pattern on your own. This will help you learn the infastructure of this pattern. Another great paper trading technique is taking a sheet of paper and placing it over a chart while slowly moving the paper to the right uncovering the daily bars a little at a time. This is one of the best methods of learning the skill of identifying formations.
We can reverse the head and shoulders top into a head and shoulders bottom.
The most critical area to look at while trying to indentify tops or bottoms is the time frame between shoulders; generaly the wider the distance of the top or bottom formation, the more reliable the formation.
Double Tops and Bottoms
One of the most common top and bottom formation is the double top and double bottom.
Graph 1
Graph 2In graph 1 our first indication that there is a change in trend comes when the market fails to penetrate the first trough, remember a down trend is a series of lower lows and lower highs. Our complete confirmation that this is a double bottom comes when prices rise above point 2.
The same principle may be applied to graph 2; at point 3 the failure to penetrate above point 1 marks a waining in the trend. When prices penetrate the low made at point 2 this signals the completion of a double top. Often times a double top will have very dramatic and violent price swings, compared to a bottom formation.
Now let's learn how to connect successivily higher lows to form an uptrend line.
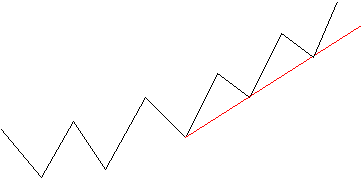
By connecting a series of lower lows when have defined a line that confinds the uptrend line. In many cases the first sign of a possible trend change comes in the form of price breaking a trendline.
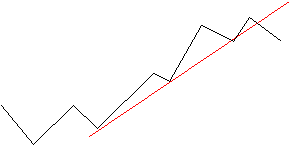
We can also identify a downtrend line by connecting a series of lower highs.
The same principle applies to the breaking of a downsloping trend line; once broken this may be our first clue that the downtrend is coming to an end.
Trend line ananlysis is one of the most simplistic yet overlooked techniques by most traders. In the case of an uptrend line once a trendline is broken this trendline now becomes resistance.
The breaking of a trendline often signals a change in trend. Trendline analysis may be extremely useful in our analysis of the commitment of traders report. In the case of a downsloping trendline coupled with the COT showing the commercials near historical levels. We could very easily trail a buy stop just above the downtrend line. When we have the COT showing the large speculators at historicaly net short levels and the commercials at historicall net long levels this leaves the market very vulnerable to heavy short covering (people who are short are now rushing to rise liquidate or "buyback" there positions.) In some instances the price reversal will spark buy signals in many technical systems and indicators since most systems or indicators are based upon price. If you would like a broker who can help you interpret the commitment of traders report please call 1-800-485-6801.
Continuation Patterns
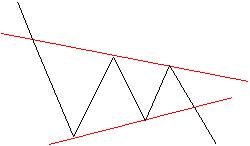
The following pattern may also be found in futures charts of various time frames. This particular pattern indicates a strong possibility of a continuation of the current trend. This pattern may develop over a week to as much as a couple of months.
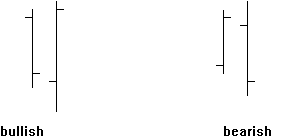
Outside day
Lower Low - Higher High
On a day when we see a lower low then the previous day, followed by a higher high, than the previous day and a close above the previous day high; this is a bullish sign and can be bought at the opening the following morning. To exit; we will place a stop below each previous days low.
Moving Averages and the MACD
Calculating the moving average (M.A.) is one of the most commonly used techniques to measure prices relative to time. A moving average is an average of prices for a given time. A 14 day M.A.
would consist of averaging the last 14 days closing prices. The 14 day MA could be constructed as follows: Day1 has a closing price of 44; day 2, 45; day3, 48; day 4, 52; day 5, 51; day 6,49; day 7, 51; day 8, 52; day 9, 49; day 10, 47 ;day 11, 44; day 12 42; day 13, 41; day 14, 38 . Now total the prices for the eighteen days then divide the total by the number of days (14). Your total should come out to 46.64. One of the practices most often used by many traders is the averaging of two different time frames, like a 14 day and 7 day average. A buy signal would occur when the 7 day crossed above the 14 day or a sell may be taken when the 7 day MA crosses below the 14 day MA. There a variety of moving average combinations that one can combine to create a buy or sell signal.M.A.C.D.
The moving average convergence/divergence indicator will depict market turning points and is considered a momentum indicator. Technicians use divergences between the indicator and price followed by a crossover of its two fast and slow lines to create a signal.
The indicator may be created as follows:
Calculate a 12 day exponential moving average.
Calculate a 26 day exponential moving average.
Subtract the 26 day exponential moving average from the 12 day exponential moving average. This will be plotted as the faster line.
Calclulate a 9 day exponential moving average of the fast line, and plot the result. This is the slow slower line.
If you would like a broker who can help you with the interpretation of the MACD applied to prices and charts, please call 800-485-6801.
*There is a risk of loss in futures trading. Past performance is not neccessarily indicative of future results.
*Any capital used for futures and options trading should be risk capitol. Risk capital is capital that if lost will not affect your lifestyle or your family life in any way.
Website Designed by
This page last modified by Bob Lade on 11/10/98