| General Statistics |
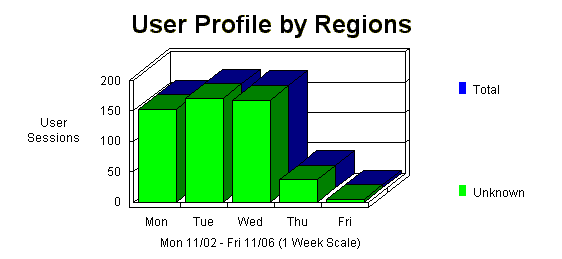
The User Profile by Regions graph identifies the general location of the visitors to your Web site. The General Statistics table includes statistics on the total activity for this server during the designated time frame.
|
|
| |
| Date & Time This Report was Generated | Friday November 06, 1998 - 11:17:54 |
| Timeframe | 11/02/98 14:43:16 - 11/06/98 10:07:26 |
| Number of Hits for Home Page | 28 |
| Number of Successful Hits for Entire Site | 5785 |
| Number of Page Views (Impressions) | 1372 |
| Number of User Sessions | 534 |
| User Sessions from (United States) | 0% |
| International User Sessions | 0% |
| User Sessions of Unknown Origin | 100% |
| Average Number of Hits per Day | 1446 |
| Average Number of Page Views Per Day | 343 |
| Average Number of User Sessions per Day | 133 |
| Average User Session Length | 00:03:05 |
This section identifies the most popular Web Site pages and how often they were accessed. The average time a user spends viewing a page is also indicated in the table.
This section identifies the least popular pages on your Web site, and how often they were accessed.
This section identifies the first page viewed when a user visits this site. This is most likely your home page but, in some cases, it may also be specific URLs that users enter to access a particular page directly. The percentages refer to the total number of user sessions that started with a valid Document Type. If the session started on a document with a different type (such as a graphic or sound file), the file is not be counted as an Entry Page, and the session is not counted in the total.
This section identifies the most common pages users were on when they left your site. The percentages refer to the total number of user sessions that started with a valid Document Type. If the session started on a document with a different type (such as a graphic or sound file), the file is not be counted as an Entry Page, and the session is not counted in the total.
This section identifies the pages on your Web site that visitors access and exit without viewing any other page. The percentages refer to the total number of user sessions that started with a valid Document Type. If the session started on a document with a different type (such as a graphic or sound file), the file is not be counted as an Entry Page, and the session is not counted in the total
This section identifies the paths people most often follow when visiting your Web site. The path begins at the page of entry and shows the next six consecutive pages viewed.
This section identifies the most popular file downloads of your Web site. If an error occurred during the transfer, that transfer is not counted.
This section identifies the companies or organizations that accessed your Web site the most often.
This section outlines general server activity, comparing the level of activity on weekdays and weekends. Averages in the table do not include erred hits.
This section shows the activity for each day of the week for the report period (i.e. if there are two Mondays in the report period, the value presented is the sum of all hits for both Mondays.) The Total Weekdays line indicates the number of hits occurring Monday through Friday of the report period. The Total Weekends line indicates the number of hits occurring Saturday and Sunday of the report period. Values in the table do not include erred hits.
This section shows the most and the least active hour of the day for the report period. The second table breaks down activity for the given report period to show the average activity for each individual hour of the day.
This table shows the total number of hits for the site, how many were successful, how many failed, and calculates the percentage of hits that failed. It may help you in determining the reliability of your site.
This section shows the number of successful form submissions compared to the number that failed. Webtrends considers anything with Post command as a form.
This section identifies the type of errors which were returned by the Client accessing your server.
This section identifies the download file types and the total kilobytes downloaded for each file type. Cached requests and erred hits are excluded from the totals.
This section helps you understand the bandwidth requirements of your site by indicating the volume of activity as Kbytes Transferred.
This section analyzes accesses to the directories of your site. This information can be useful in determining the types of data most often requested.
This report was generated by WebTrends.
Most Requested Pages
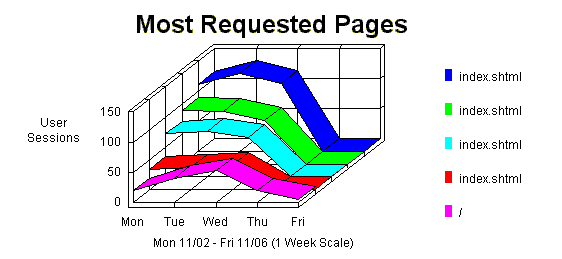
/ParseIt/index.shtml498 36.29% 353 00:01:17
/ParseIt/files/index.shtml281 20.48% 248 00:01:29
/ParseIt/features/index.shtml234 17.05% 211 00:00:54
/ParseIt/about/index.shtml151 11% 110 00:00:19
/ParseIt/141 10.27% 135 00:00:41
/28 2.04% 22 00:00:26
/index.shtml21 1.53% 12 00:05:20
/aboutus/index.shtml5 0.36% 4 00:01:10
/news/index.shtml3 0.21% 2 00:00:29
/aboutus/us.html2 0.14% 2 00:00:23
Sub Total For the Page Views Above
1364
99.41%
N/A
N/A
Total For the Log File
1372
100%
N/A
N/A
Least Requested Pages
/ParseIt/about/../files/index.shtml1 0.07% 1
/pngindex.shtml1 0.07% 1
/ParseIt/about/1 0.07% 1
/hosting/form.html1 0.07% 1
/hosting/index.shtml1 0.07% 1
/ParseIt/about/../features/index.shtml1 0.07% 1
/ParseIt/files/1 0.07% 1
/ParseIt/about/../index.shtml1 0.07% 1
/aboutus/us.html2 0.14% 2
/news/index.shtml3 0.21% 2
Top Entry Pages
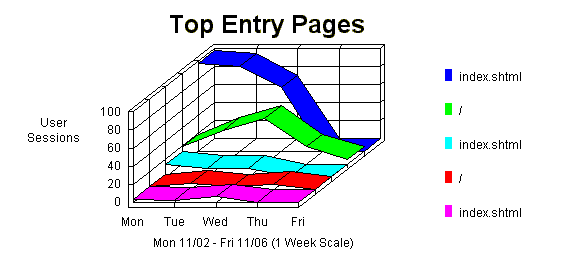
/ParseIt/index.shtml55.76% 261
/ParseIt/27.77% 130
/ParseIt/files/index.shtml6.83% 32
/4.05% 19
/ParseIt/features/index.shtml2.35% 11
/index.shtml1.92% 9
/aboutus/index.shtml0.64% 3
/ParseIt/about/index.shtml0.64% 3
Total For the Pages Above
100%
468
Top Exit Pages
/ParseIt/files/index.shtml34.47% 161
/ParseIt/index.shtml26.76% 125
/ParseIt/features/index.shtml15.2% 71
/ParseIt/8.35% 39
/ParseIt/about/index.shtml7.7% 36
/4.49% 21
/index.shtml1.07% 5
/news/index.shtml0.42% 2
/aboutus/index.shtml0.42% 2
/ParseIt/files/0.21% 1
Total For the Pages Above
99.14%
463
Single Access Pages
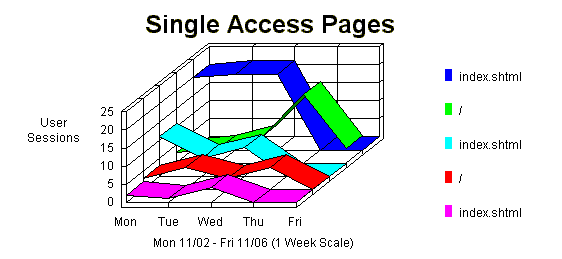
/ParseIt/index.shtml39.74% 62
/ParseIt/23.71% 37
/ParseIt/files/index.shtml15.38% 24
/11.53% 18
/ParseIt/features/index.shtml4.48% 7
/index.shtml3.2% 5
/ParseIt/about/index.shtml1.28% 2
/aboutus/index.shtml0.64% 1
Total For the Pages Above
100%
156
Top Paths Through Site
1. /ParseIt/index.shtml 13.27% 62 1. /ParseIt/index.shtml
2. /ParseIt/files/index.shtml12.41% 58 1. /ParseIt/ 7.92% 37 1. /ParseIt/files/index.shtml 5.13% 24 1. /ParseIt/index.shtml
2. /ParseIt/features/index.shtml
3. /ParseIt/files/index.shtml4.71% 22 1. /ParseIt/index.shtml
2. /ParseIt/features/index.shtml4.28% 20 1. / 3.85% 18 1. /ParseIt/index.shtml
2. /ParseIt/files/index.shtml
3. /ParseIt/features/index.shtml2.78% 13 1. /ParseIt/
2. /ParseIt/index.shtml2.56% 12 1. /ParseIt/
2. /ParseIt/index.shtml
3. /ParseIt/features/index.shtml2.35% 11
Total For the Paths Above
59.31%
277
Most Downloaded Files
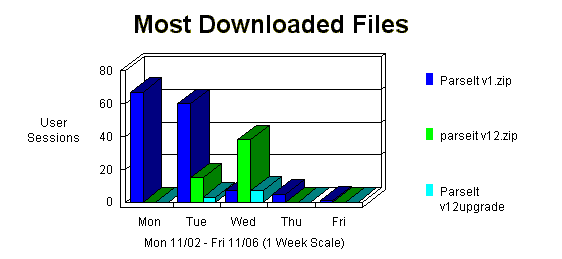
/ParseIt/files/ParseIt_v1.zip 152 67.25% 140 /ParseIt/files/parseit_v12.zip 61 26.99% 53 /ParseIt/files/ParseIt_v12upgrade.zip 13 5.75% 10
Total For the Files Above
226
100%
N/A
Most Active Organizations
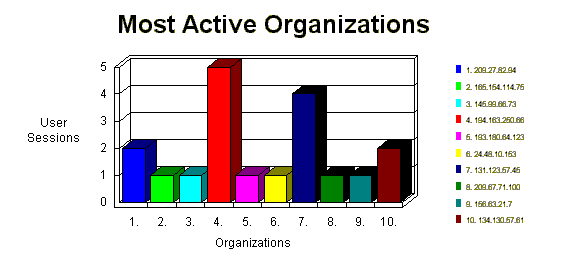
209.27.82.9490 1.55% 2
165.154.114.7582 1.41% 1
145.99.66.7367 1.15% 1
194.163.250.6661 1.05% 5
193.180.64.12351 0.88% 1
24.48.10.15351 0.88% 1
131.123.57.4547 0.81% 4
209.67.71.10043 0.74% 1
156.63.21.742 0.72% 1
134.130.57.6141 0.7% 2
Subtotal For Companies Above
575
9.93%
19
Total For the Log File
5785
100%
534
Summary of Activity by Day
Average Number of Users per day on Weekdays
106
Average Number of Hits per day on Weekdays
1157
Average Number of Users for the entire Weekend
0
Average Number of Hits for the entire Weekend
0
Most Active Day of the Week
Tue
Least Active Day of the Week
Sun
Most Active Day Ever
November 03, 1998
Number of Hits on Most Active Day
2029
Least Active Day Ever
November 06, 1998
Number of Hits on Least Active Day
6
Activity Level by Day of Week
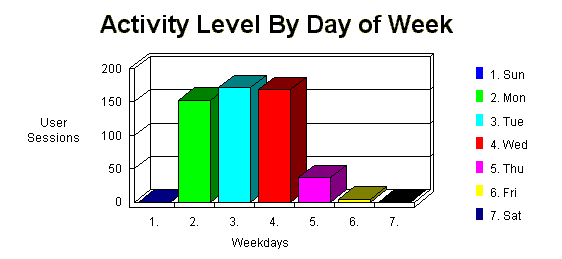
Sun 0 0% 0 Mon 1699 29.36% 153 Tue 2029 35.07% 171 Wed 1707 29.5% 168 Thu 344 5.94% 37 Fri 6 0.1% 5 Sat 0 0% 0
Total Weekdays
5785
100%
534
Total Weekend
0
0
0
Activity Level by Hour of the Day

Most Active Hour of the Day
16:00-16:59
Least Active Hour of the Day
06:00-06:59
00:00-00:59 233 4.02% 18 01:00-01:59 218 3.76% 20 02:00-02:59 265 4.58% 19 03:00-03:59 234 4.04% 16 04:00-04:59 93 1.6% 14 05:00-05:59 104 1.79% 14 06:00-06:59 58 1% 12 07:00-07:59 282 4.87% 18 08:00-08:59 192 3.31% 15 09:00-09:59 88 1.52% 7 10:00-10:59 106 1.83% 19 11:00-11:59 170 2.93% 19 12:00-12:59 116 2% 14 13:00-13:59 152 2.62% 16 14:00-14:59 291 5.03% 25 15:00-15:59 583 10.07% 49 16:00-16:59 627 10.83% 55 17:00-17:59 368 6.36% 42 18:00-18:59 340 5.87% 30 19:00-19:59 227 3.92% 16 20:00-20:59 201 3.47% 20 21:00-21:59 367 6.34% 37 22:00-22:59 292 5.04% 25 23:00-23:59 178 3.07% 14
Total Users during Work Hours (8:00am-5:00pm)
2325
40.19%
219
Total Users during After Hours (5:01pm-7:59am)
3460
59.8%
315
Technical Statistics and Analysis
Total Hits
7341
Successful Hits
5785
Failed Hits
1556
Failed Hits as Percent
21.19%
Cached Hits
670
Cached Hits as Percent
9.12%
Forms Submitted By Users

Failed Forms Submitted 2 100%
Total
2
100%
Client Errors
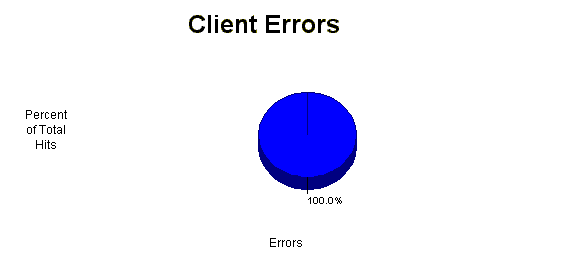
404 Page or File Not Found 1556 100%
Total
1556
100%
Most Downloaded File Types and Sizes
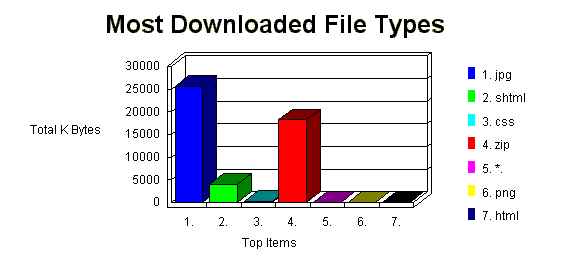
jpg 2701 25,666K shtml 1198 4,028K css 825 190K zip 224 18,249K *. 161 31K png 3 51K html 3 4K
Total Files & K Bytes Transferred
5115
48,217K
Bandwidth

Most Accessed Directories

/ParseIt 5288 91.4% 89.52% 45,076K 503 /images 409 7.07% 73.59% 2,716K 28 / 69 1.19% 88.4% 250K 33 /aboutus 9 0.15% 100% 61K 4 /hosting 4 0.06% 100% 45K 1 /pngimages 3 0.05% 100% 51K 1 /news 3 0.05% 100% 20K 2 ![[WebTrends Corporation]](wtlogoss.gif)